A huge correction is coming to the market.
But it isn’t the one you might be thinking…
Earlier this month, I argued that the Fed gave the signal to send gold up another 100%.
Today, we have another 08-09 parallel to draw upon. And it could have implications much larger than a simple double.
If this plays out as it should, the profit potential could be exponential.
Let’s begin back in the terrible cold days of November 2008…
The Turning Point
For months the Financial Crisis had been waging on.
Bear Stearns and Lehman Brothers had both failed.
Fannie Mae and Freddie Mac had been taken over by the government.
By mid-November 2008, it looked like Citigroup was the next major bank to fail. Shares dropped 23% on Nov. 19. The next day, they dropped another 26%.
By the end of the weekend, it was clear that Citigroup would disappear the minute markets opened the following day.
So, on Sunday, November 23, the Fed and the Treasury Department announced that they were stepping in.
But something else was happening just then. On Friday, Nov. 21, when everyone was holding their breath over the fall of the next “too-big-to-fail” bank, another indicator started lighting up.
Over in the precious metals market, gold was kicking off its second and far more impressive rally. This is when gold started climbing. It didn’t stop until 2011 at more than twice its price.

Grab a piece of paper and pen to write this down…
Because you’re about to see the name and ticker symbol of the ONLY 5G STOCK every investor should own.
You can get the name and ticker of this company right here, no strings attached. But you better act fast…
Because the Federal Communications Commission, the government agency in charge of 5G, just scheduled a major announcement that would send shares soaring once announced.
Don't miss out. Click Here to Get #1 5G play for 2020 before the next market close.
But something else started happening then too. Silver was now in play.
To see what I mean, just take a look at these three charts…
3 Charts Point the Way
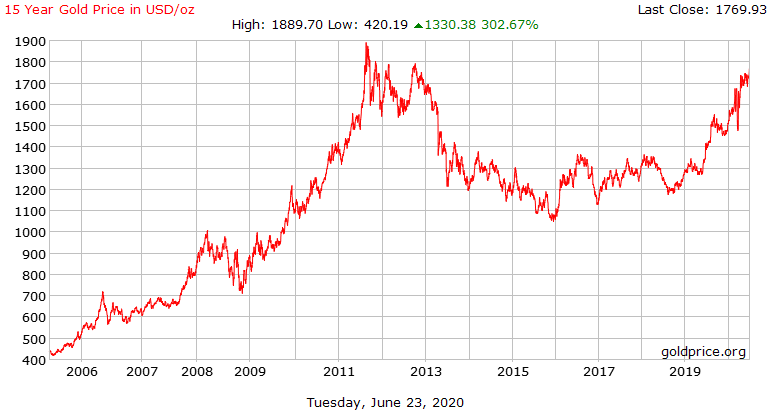
This first one is the last 15 years of gold prices:

You can see the near-term bottom in November 2008. But also take note of what it was doing in the years prior. It had been already going up.
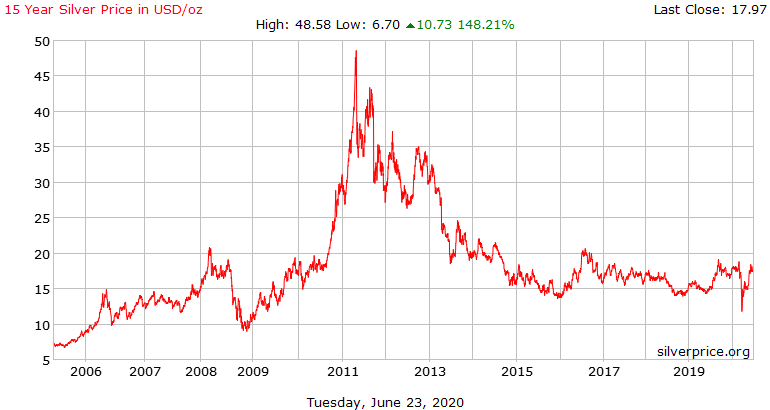
Now, let’s turn to gold’s little sister, silver:

It too found a bottom in November 2008. Well, actually in October. But only for a few days. The point is what it had been doing prior to late 2008. It had gone up. But by October and November, it was back down to even with where it was two years before.
Just like it is today.
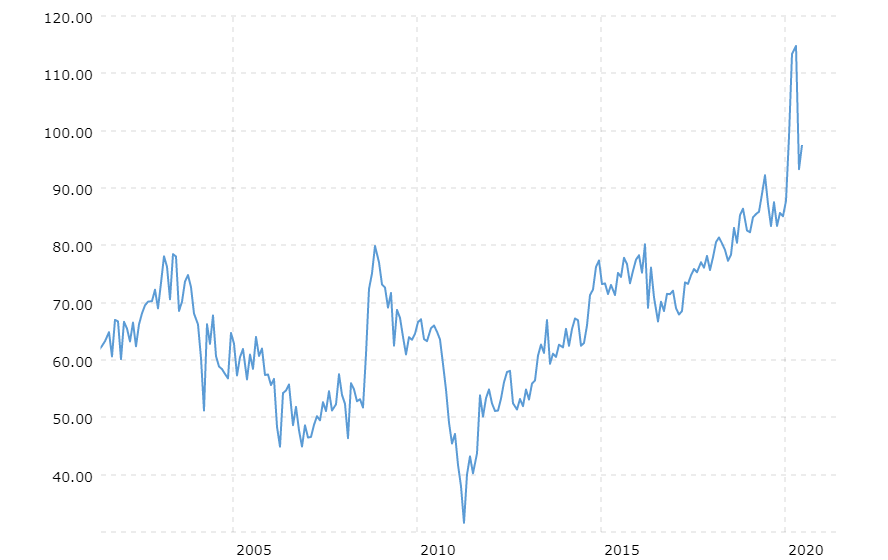
This third chart shows the full picture:

Here is the gold-to-silver ratio. Basically, it shows how many ounces of silver you can buy with one ounce of gold.
More importantly, it shows exact points in time when silver goes from being only an “industrial” metal to “precious” metal.
What Happens to Silver When This Ratio Reverses
From late-2008 until mid-2011, gold more than doubled. Silver, however, quintupled.
The way it works is simple enough. As gold started its climb, silver followed. But because it had previously lagged, leading to that peak in the gold-to-silver ratio, it had farther to climb.
That’s how silver can multiply gains in gold.
Well, look where all of this stands now. Go back to those three charts, and check out where silver is compared to gold… and just what happened to the gold-to-silver ratio over the last two months.
That’s right. It peaked again. This time even higher. An all-time high in the ratio, as a matter of fact.
We stand by our prediction that gold could easily double in the next two years. But we’ll add to it.
Silver could quintuple… again. Maybe even more.
Now is an ideal time to get into a position in silver.
What's the Best Way to Profit From This?
In this article, I gave you my best of the breed pick on riding silver higher.
To your prosperity,
Joshua M. Belanger
Founder & Publisher