There’s an insider’s trick to predicting a wild movement in a stock’s price. And it’s built on Wall Street’s most-broken data point.
Twenty-one years ago, this month, one insider laid out the problem very succinctly.
James Weiss, investment chief at State Street Research, told the LA Times, “Price targets generated by Wall Street analysts may be trying to serve multiple masters.”
While noting that a bank’s stock research department is supposed to be completely separate from its investment banking arm, that is not usually the case. And that “an analyst who feels very bullish about a stock may lay on another 30 points just to say to the company, ‘We’re a big supporter.’”
That in a nutshell is the side of Wall Street that has been broken since the very beginning.
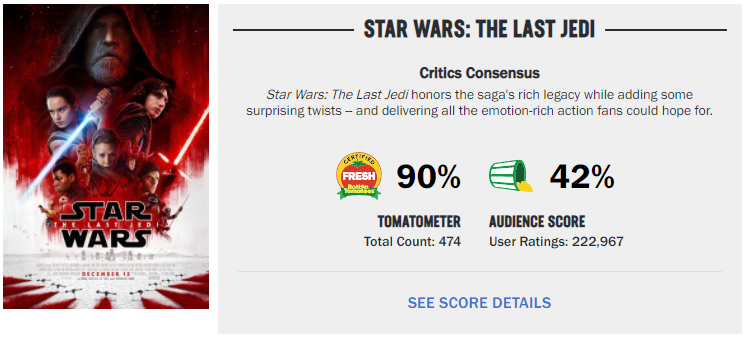
You see it in other places too. Movie critics are often criticized themselves for arbitrarily overrating a film just to remain friendly with a studio or PR person in the industry. Just check out Rotten Tomatoes some time to see how differently critics and audiences can view the same movie.
So, it’s not that big of a surprise that analysts and insiders at companies they cover might not have the public’s best interest in mind.
But I remind you, that was 21 years ago when this insider said too much.
What have we learned since?
A single analyst on Wall Street may cover 35-50 different stocks at any one time. And in a year full of IPOs and new companies coming to market, that number can fluctuate even higher.
On top of that, each analyst typically updates and revises his or her price targets for each of those several times each year.
With hundreds of mainstream analysts, that adds up to thousands upon thousands of potential winners or losers in their calls.
So, it may be easy to say that the closeness and spurious nature of analysts and their target companies produces a lot of bad calls. But, with numbers this large, they do get a lot right too.
Instead of just picking apart some of the worst calls in recent memory, like the complete failure of analysts to foresee any problems in the financial crisis, let’s look at the bigger picture.
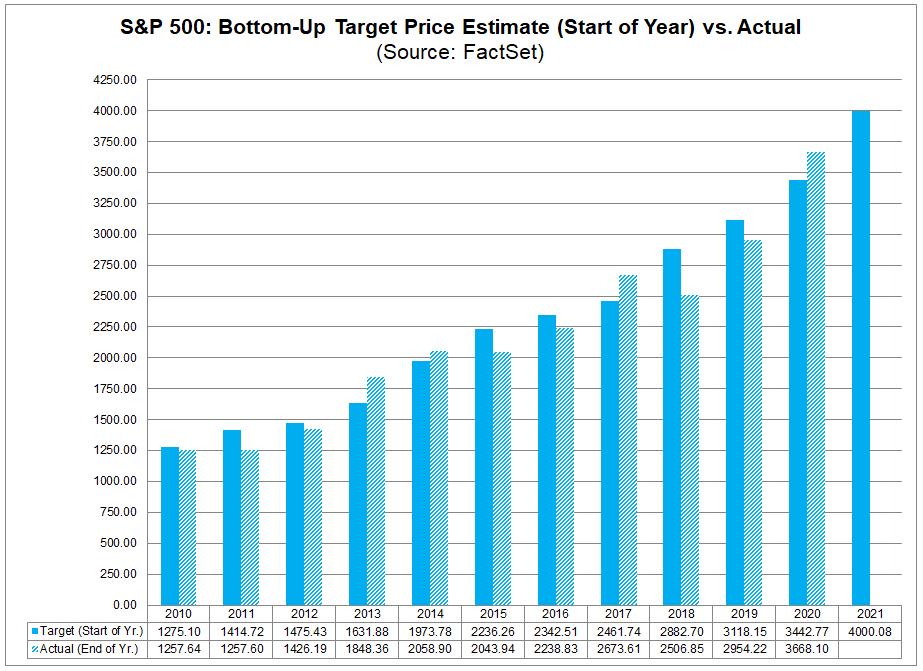
According to FactSet, analysts get the bigger picture wrong far more often than not. And in most cases, they get it wrong in overvaluing the market.

Grab a piece of paper and pen to write this down…
Because you’re about to see the name and ticker symbol of the ONLY 5G STOCK every investor should own.
You can get the name and ticker of this company right here, no strings attached. But you better act fast…
Because the Federal Communications Commission, the government agency in charge of 5G, just scheduled a major announcement that would send shares soaring once announced.
Don't miss out. Click Here to Get #1 5G play for 2020 before the next market close.
Of the last 15 years, analysts on average overestimated the performance of the S&P 500 12 times. Meaning, Wall Street itself expected the market to do better than it did 80% of the time. That’s during a period when the S&P 500 tripled in value. So, those overestimations were even larger.
But on individual stocks, it looks even worse.
An Indiana University and Yale study in 2019 found that not only were consensus targets not informative, they were inversely correlated to performance.
It found that the stocks with the highest predicted returns (those where the analysts averaged a large price jump from current prices) produced the lowest future realized returns.
But this study also concluded with another big takeaway, one we can build into our own predictions and expectations.
The second conclusion was that even more important than the size of predicted gains was the disparity of the targets themselves.
When analysts generally agreed that a particular stock was set to go up, it typically did. Though, if just a handful strongly disagreed with far lower price targets, those few were more often right.
The level of dispersion, as it is called in this study, actually predicts large price swings, particularly to the downside as analysts generally agree on rising stock prices.
That’s an important piece of information going forward. And it’s especially useful when looking at this headline from MarketWatch this morning: “Morgan Stanley lifts target price on Tesla to $810, while Barclays reiterates $230 view.”
Think about that. This a perfect example of disparity. One analyst believes Tesla is going to grow 10% over the next 12 months. Another believes it will lose nearly three-quarters of its value.
Of course, I certainly won’t start placing any bets on the work of these two analysts. But if history tells us anything, Tesla’s wild price action isn’t going to settle down anytime soon.
And it also proves, yet again, that Wall Street can make very little sense left to its own devices.
To your prosperity and health,
Joshua M. Belanger